
Quiz Funnel Metrics: The Numbers That Matter (and How to Read Them)
"The quiz isn't converting" is not a diagnosis — it's a symptom with five possible causes, and each one has a different fix. The whole point of running a quiz funnel as a direct response asset is that, unlike a static page, it tells you exactly where it's broken. Every slide is a measurable checkpoint. This guide covers the numbers worth watching, what each one actually diagnoses, and how to turn them into a repeatable improvement loop.
📊 The five numbers
| Metric | What it measures | A weak number points to |
|---|---|---|
| Start rate | Of people who see the quiz, how many begin | The hook, the placement, or the ad → quiz handoff |
| Completion rate | Of starters, how many reach the end | A question that's long, confusing, or intrusive |
| Per-question drop-off | Which slide loses people | The exact slide to fix — this is the money metric |
| Opt-in rate | Of shoppers who reach the gate, how many trade their email | Gate placement or an unfair-feeling trade |
| Result-to-cart | Of finishers, how many act on the recommendation | The result page: hero clarity, the "because," the offer |
Two more sit above the funnel as the scoreboard: quiz-attributed conversion rate (finishers who purchase) and revenue per quiz start, which is the number that lets you compare the quiz against any other lander per click. Diagnose with the five; keep score with these two.
🔍 Per-question drop-off: the money metric
Everything else tells you that something's wrong; this tells you where. A funnel view across slides turns vague underperformance into a work order:
- A cliff at question two? It's probably asking for effort or intimacy the shopper hasn't warmed up to — move it later or make it easier.
- A cliff at the email gate? Your trade doesn't feel fair yet — fix the gate, not the quiz.
- No cliff anywhere, but weak result-to-cart? The questions are fine; the payoff screen isn't.
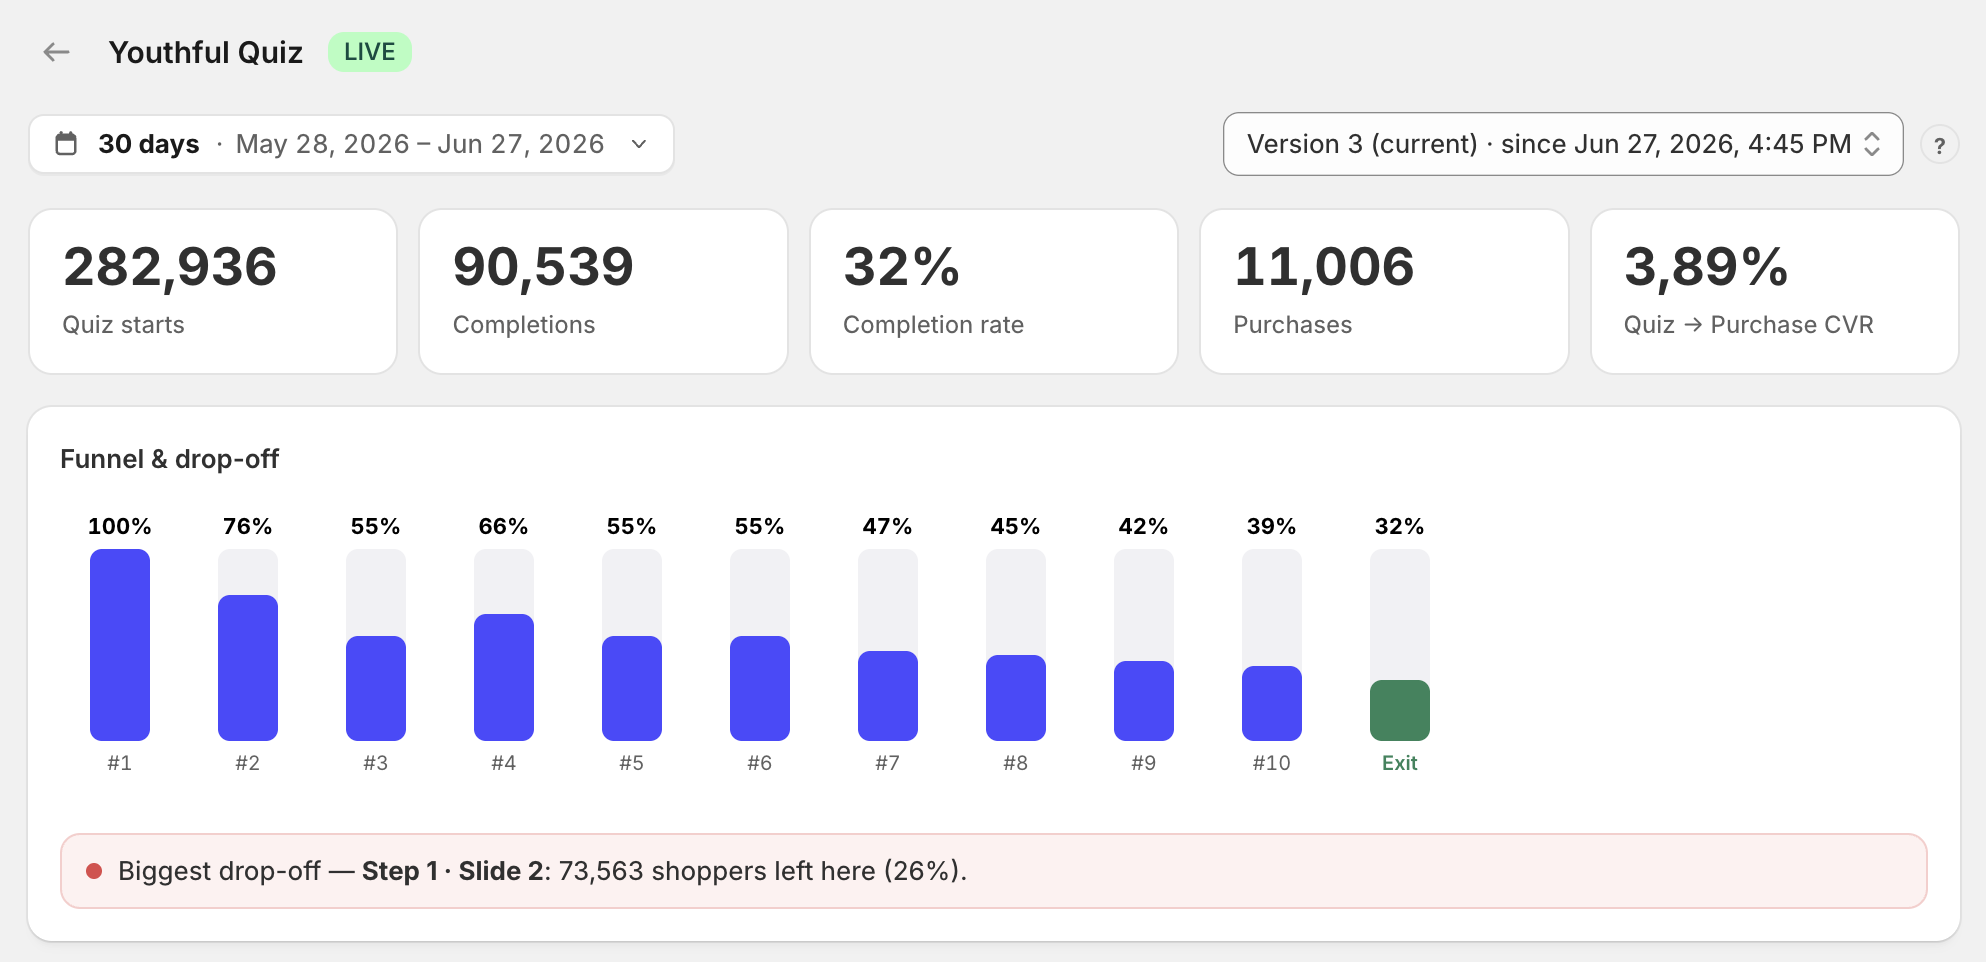
The funnel view finds the leak for you — the slide bleeding the most shoppers is flagged, so you fix that one first.
For paid traffic there's a bonus diagnosis: drop-off patterns separate ad problems from funnel problems. Healthy completion but a weak start rate means the funnel's fine and the ad handoff isn't. That distinction alone settles arguments that otherwise run for weeks — the Meta ads guide covers the full decision table.
🧮 What about benchmarks?
Here's the honest take: published quiz benchmarks vary wildly because traffic source, niche, question count, and gate policy all move the numbers — a five-question on-store gift finder and an eight-question cold-traffic funnel aren't the same instrument. Treat any universal "good completion rate is X%" claim with suspicion, ours included.
What actually works:
- Baseline yourself. Two weeks of real traffic, numbers recorded.
- Rank the leaks. The stage losing the most shoppers relative to the others is your priority — the funnel view makes this visual.
- Change one thing, re-measure. Your own week-over-week trend is the only benchmark that can't mislead you.
Rules of thumb that are safe: drop-off should be roughly gradual — any single slide with a visibly sharper cliff than its neighbors is a defect, whatever the absolute numbers. And direction beats level: a funnel improving 10% a month beats a static one that started stronger.
🔁 The improvement loop
The metrics only pay when they drive edits. The loop that compounds:
- Watch the funnel view weekly — not obsessively, but on a rhythm.
- Fix the single biggest leak — one change, so you know what moved the number.
- Re-measure against the baseline, keep or revert.
- Repeat. A quiz improved 5% at three different stages converts dramatically better end-to-end, because funnel stages multiply.
This is where an AI layer genuinely earns its keep: QuizLanding's assistant reads your quiz and your data and proposes the specific edit — "question four is your biggest leak; here's a shorter version" — turning the loop from an analysis session into a to-do list.
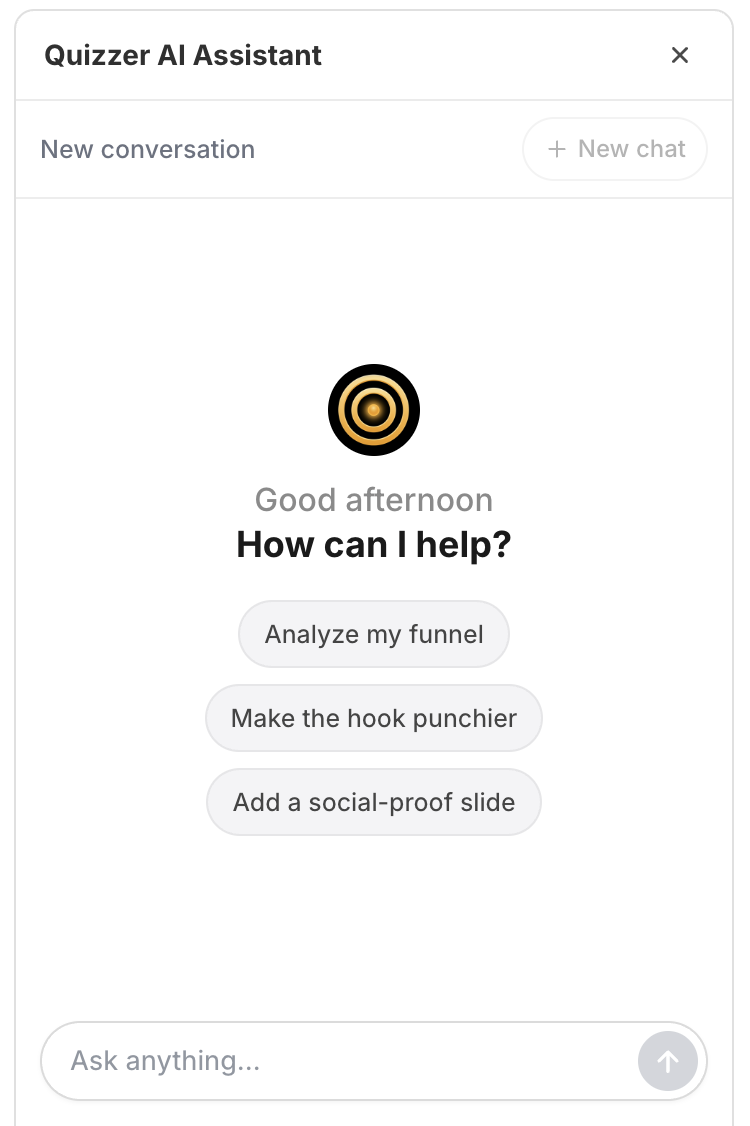
From "the quiz underperforms" to a concrete edit list — the assistant reads the funnel data and names the fix.
🧾 Don't ignore the answers themselves
One layer below the funnel numbers sits a data set most brands never open: what shoppers actually answered. In aggregate, your quiz is a continuously running customer survey — which problems dominate, which goals cluster, which answer combinations buy best. That's input for ad angles, product pages, even product development. And individual response trails (what they picked, where they exited) make abandonment patterns concrete instead of statistical.
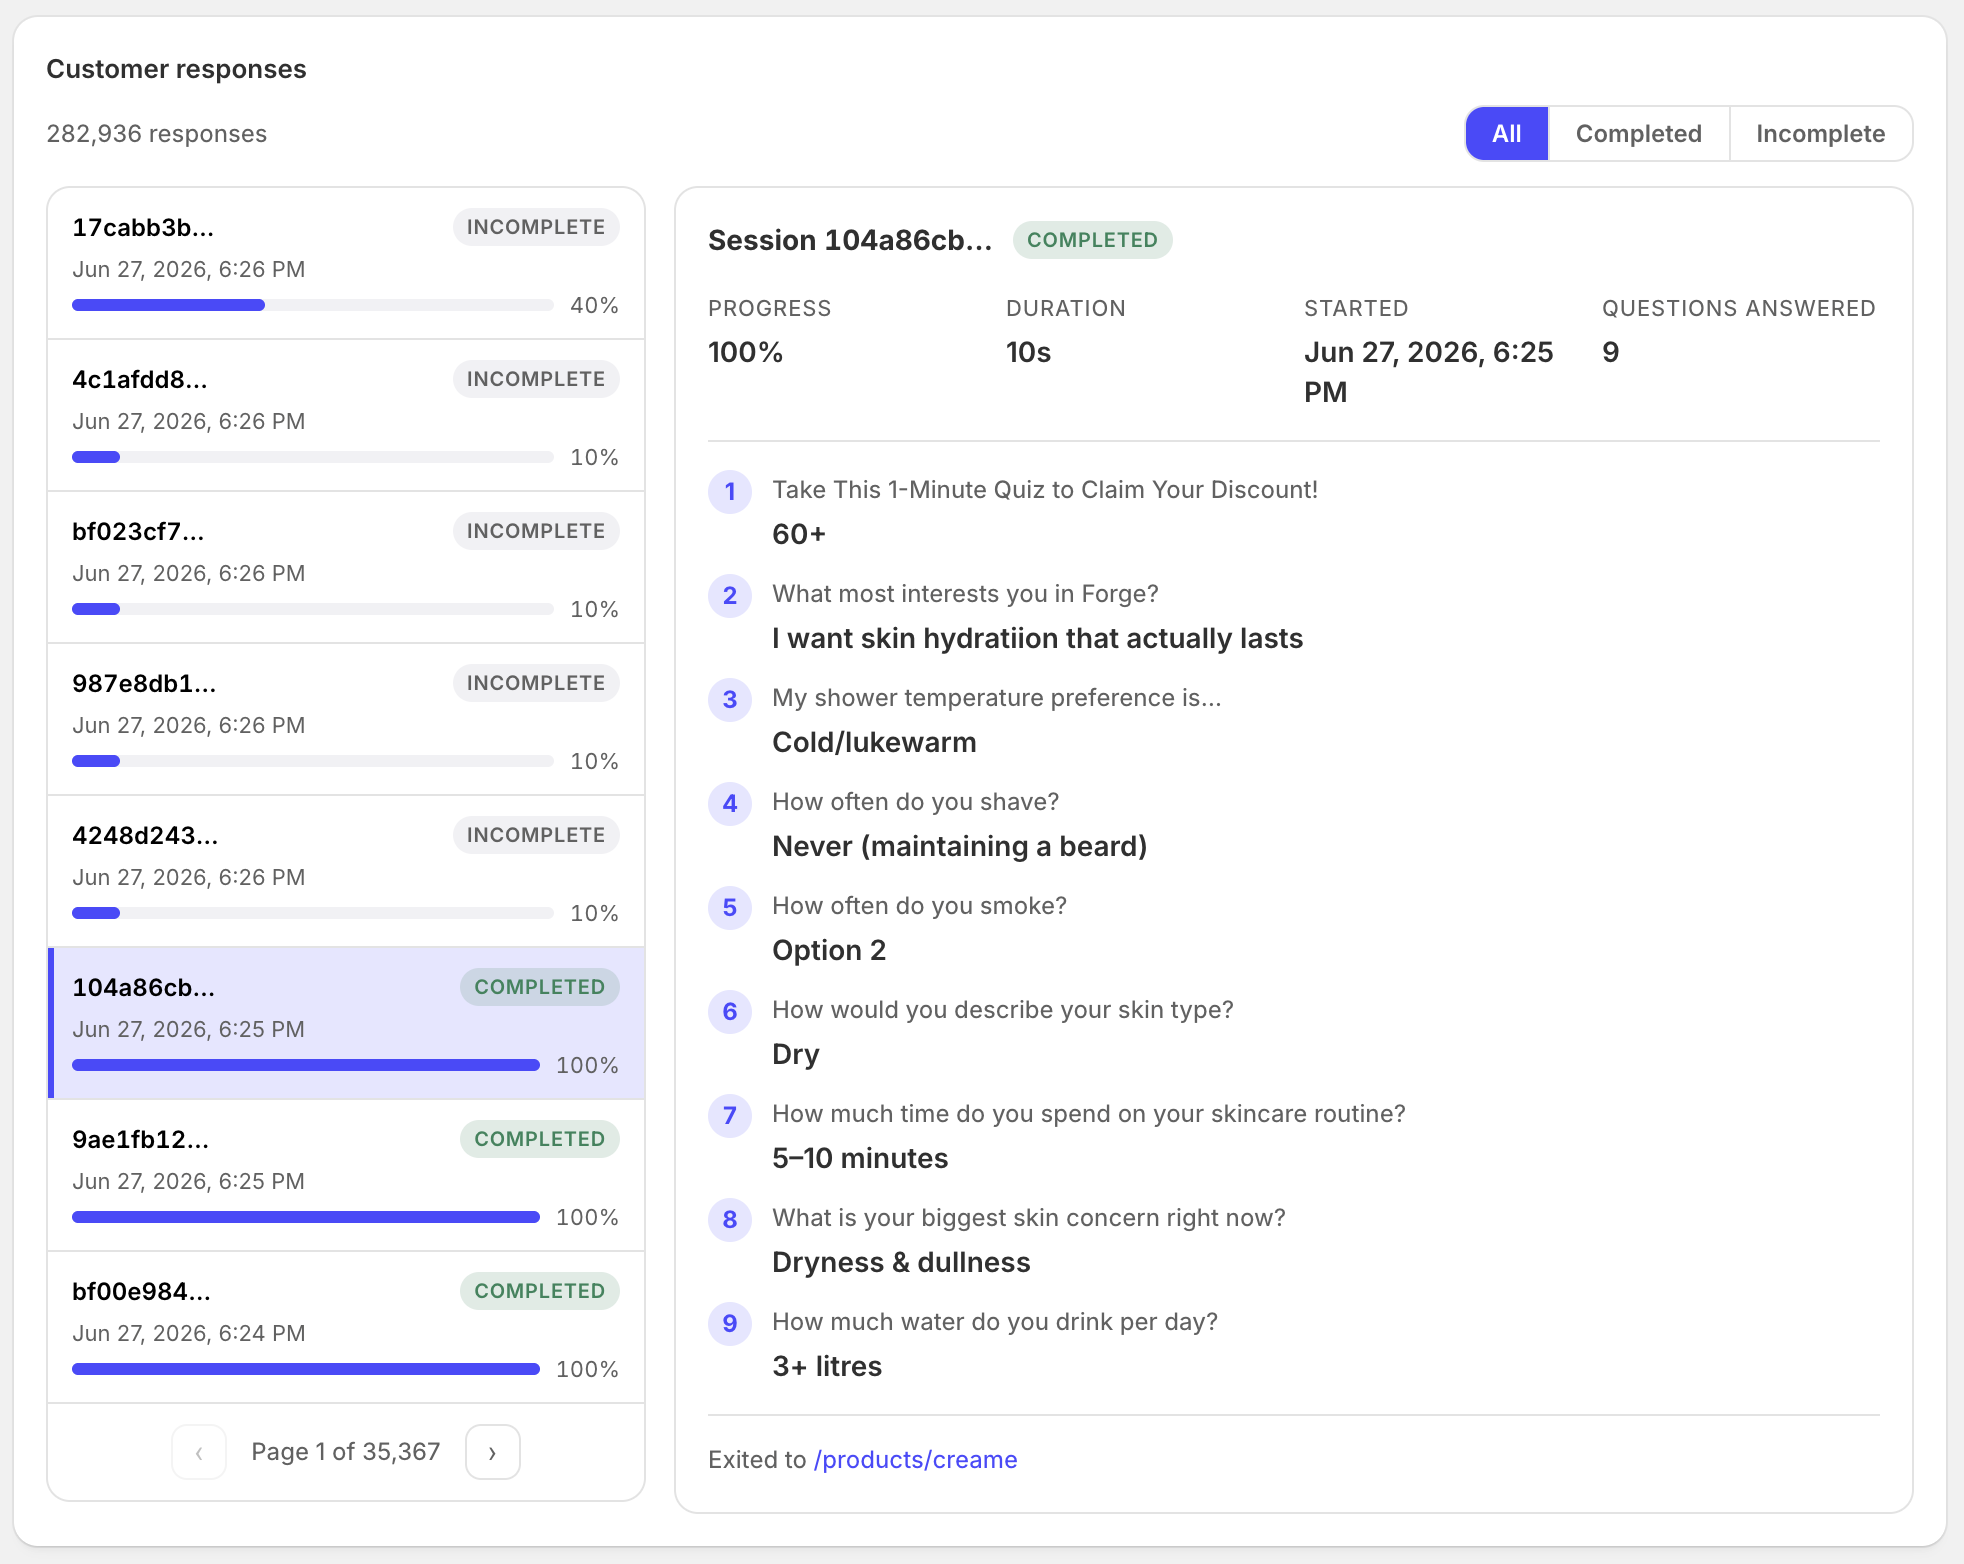
Beneath the rates: real sessions, real answers, real exit points — first-party signal you own.
❓ Frequently asked questions
How much traffic do I need before the numbers mean anything?
Enough that a slide's drop-off looks like a pattern rather than a coincidence — a few hundred starts is a reasonable floor for trusting per-question comparisons. Below that, ship obvious fixes without waiting for statistics.
Should I A/B test or just iterate?
Iterating on the biggest leak with before/after comparison is the highest-leverage move for most stores; formal split tests make sense once traffic is large enough to resolve small differences. Either way: one change at a time.
Which number should I check first each week?
Revenue per quiz start for the scoreboard, then the funnel view for the diagnosis. Two numbers, five minutes.
Do I need a separate analytics tool?
Your quiz platform should carry this natively — per-slide funnel, opt-in, result-to-cart, response trails. If seeing your own data costs an upgrade tier, that's worth weighing before you commit; with QuizLanding the full analytics stack ships in the one flat plan.
✅ The takeaway
Five numbers — start, completion, per-question drop-off, opt-in, result-to-cart — and a simple discipline: baseline, fix the biggest leak, re-measure, repeat. Skip the benchmark anxiety; your own trend is the truth. A quiz funnel's real advantage over a static page isn't just that it converts differently — it's that it tells you why, slide by slide, if you look.
More on each stage: question writing, the email gate, the result page, and the mistakes that show up in these numbers.
Want a quiz funnel live on your Shopify store this week? QuizLanding drafts your quiz with AI, hosts it natively on your store, and pairs full analytics with an AI assistant that tells you what to improve — all in one flat plan. Start for free.